
An EPAC biosensor to measure cAMP levels
How the biosensor works
G protein coupled receptors (GPCRs) linked to Gαs or Gαi/o family members exert their biological functions primarily via modulating production of the second messenger cyclic adenosine 3′,5′-monophosphate (cAMP). Members of the Gαs family of heterotrimeric G proteins (i.e., Gαs, Gαolf) activate adenylyl cyclases (ACs), which are the enzymes responsible for converting ATP to cAMP. Conversely, members of the Gαi/o family of heterotrimeric G proteins (i.e., Gαi1-3, GαoA-B, Gαz) inhibit ACs and thus reduce intracellular cAMP concentrations. cAMP mediates its pleiotropic effects partly by binding to the regulatory subunits of protein kinase A (PKA, or cAMP-dependent protein kinase), resulting in the release and subsequent activation of bound catalytic subunits. PKA-independent effects of cAMP include activation of cyclic nucleotide-gated ion channels and regulation of the guanine nucleotide exchange proteins activated by cAMP (EPAC1 and 2) (1-2).
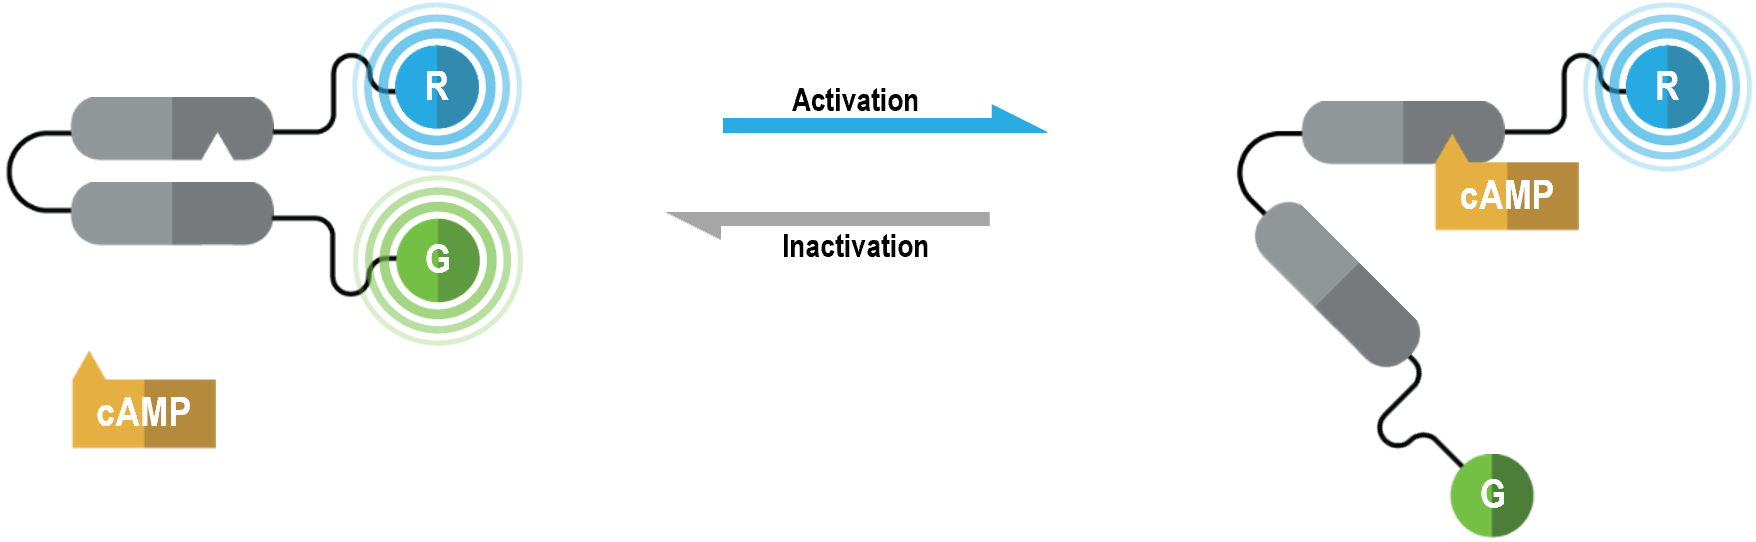
The bioSens-All® unimolecular cAMP double-brilliance sensor consists of the EPAC protein with N- and C-terminal Renilla luciferase (RLuc; R in figure below) and green fluorescent protein (GFP; G in following figure) tags, respectively. In its basal state, this biosensor exists in a closed conformation resulting in maximal BRET efficiency between RLuc and GFP. Binding of cAMP to EPAC results in a structural rearrangement that promotes an opened biosensor conformation. The latter conformational change induces a physical separation of RLuc and GFP, consequently reducing BRET efficiency to a degree that is inversely proportional to intracellular cAMP levels.
Cyclic AMP data generated with our EPAC biosensor
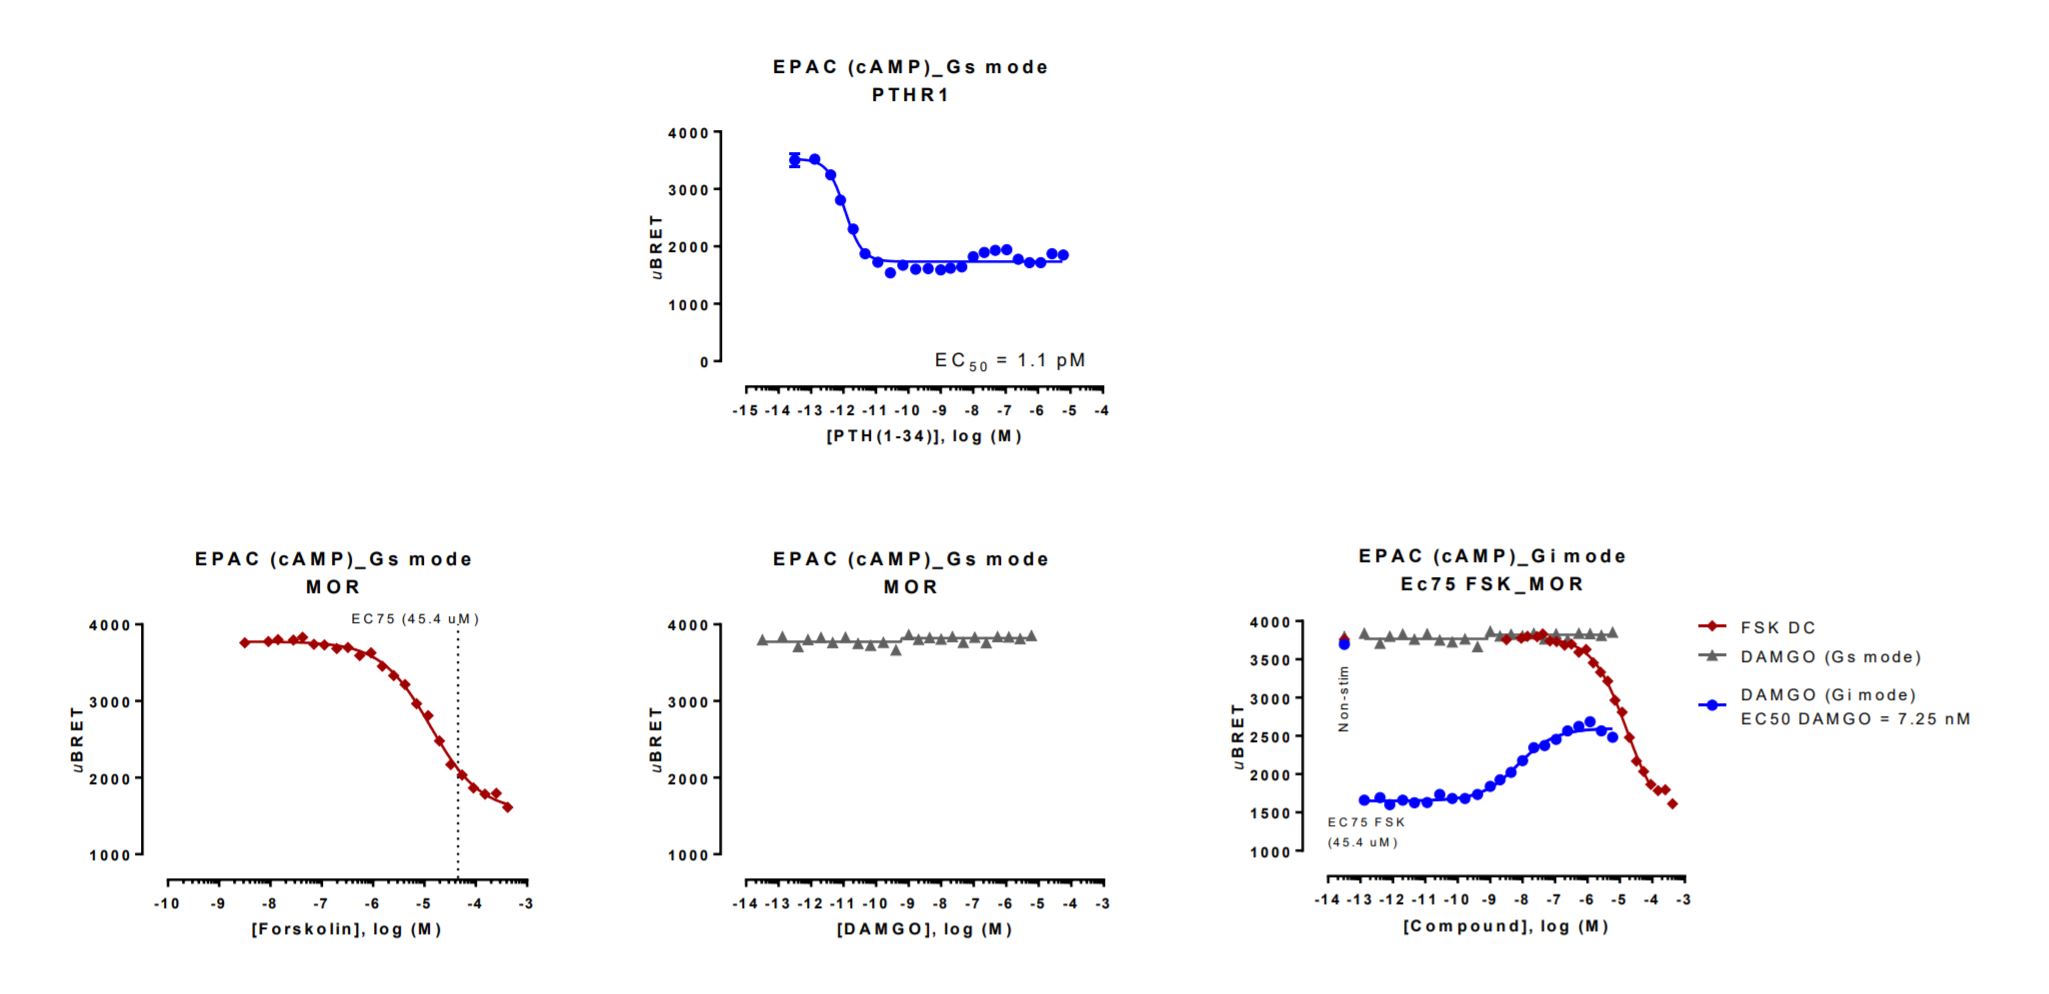
HEK293 cells were transfected with a receptor coding plasmid (human mu opioid receptor (MOR) or human parathyroid hormone type 1 receptor (PTHR1)) in addition to the EPAC cAMP biosensor coding plasmid. On the day of BRET, cells were rinsed with assay buffer, incubated with coelenterazine and increasing amounts of PTH(1-34) for 10 minutes and BRET subsequently measured (top). The EPAC cAMP biosensor was also used in “Gi mode” with MOR (bottom). In this assay, cells were rinsed with assay buffer, incubated with coelenterazine and increasing amounts of forskolin for 10 minutes and BRET subsequently measured. Stimulation with forskolin induced the production of cAMP and the resulting dose-response curve was used for the calculation of the EC75 (left). A separate set of cells were washed, incubated with coelenterazine and increasing amounts of DAMGO for 10 minutes and BRET subsequently measured. This initial measure is used to assess DAMGO’s ability to stimulate cAMP production (“Gs mode”; middle). A concentration corresponding to the EC75 of forskolin was then immediately added to the same cells previously treated with DAMGO. Cells were incubated for an additional 15 minutes and BRET measured again. This second measure is used to assess DAMGO’s ability to reverse forskolin-induced cAMP production (“Gi mode”; right). Reversal of forskolin-induced cAMP production by DAMGO is seen by the DAMGO dose-dependent increase in BRET (blue curve).